Major Tornado Outbreak Ravages Central United States: Why It Happened
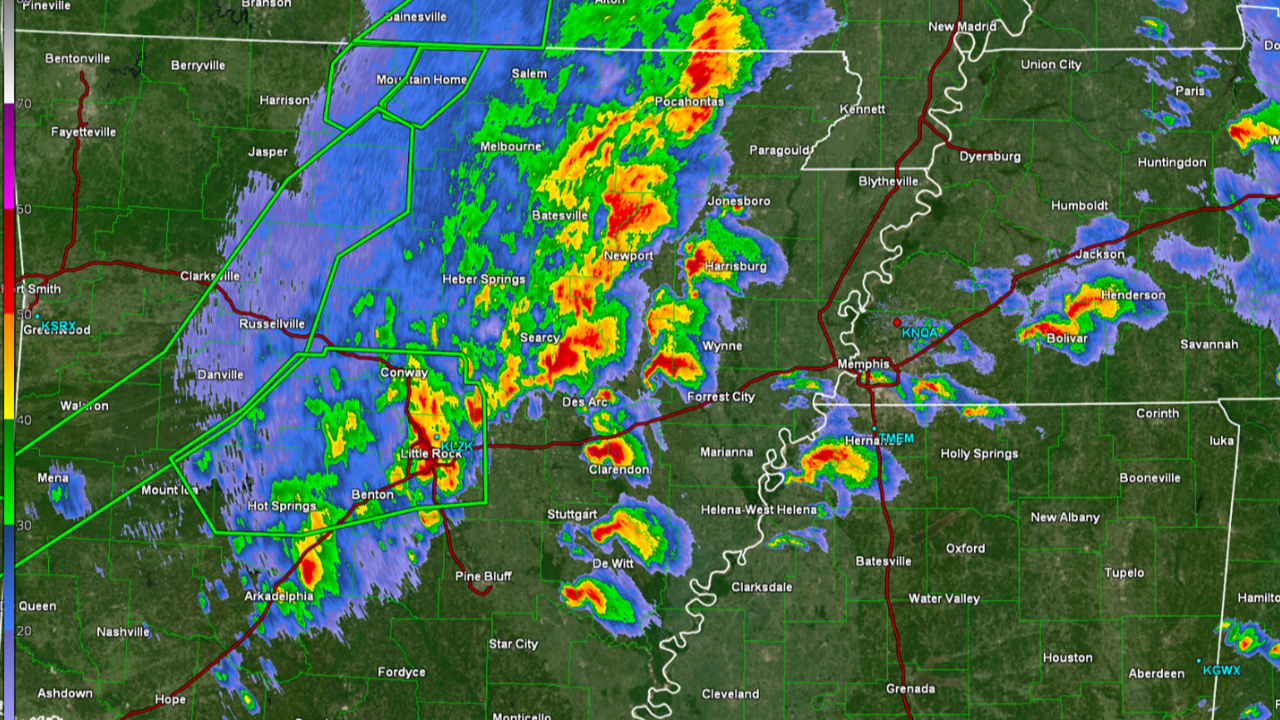
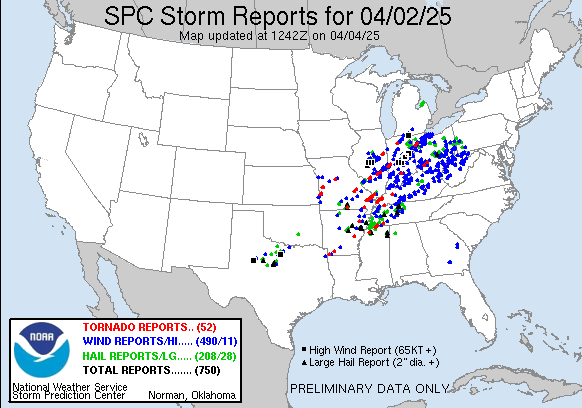
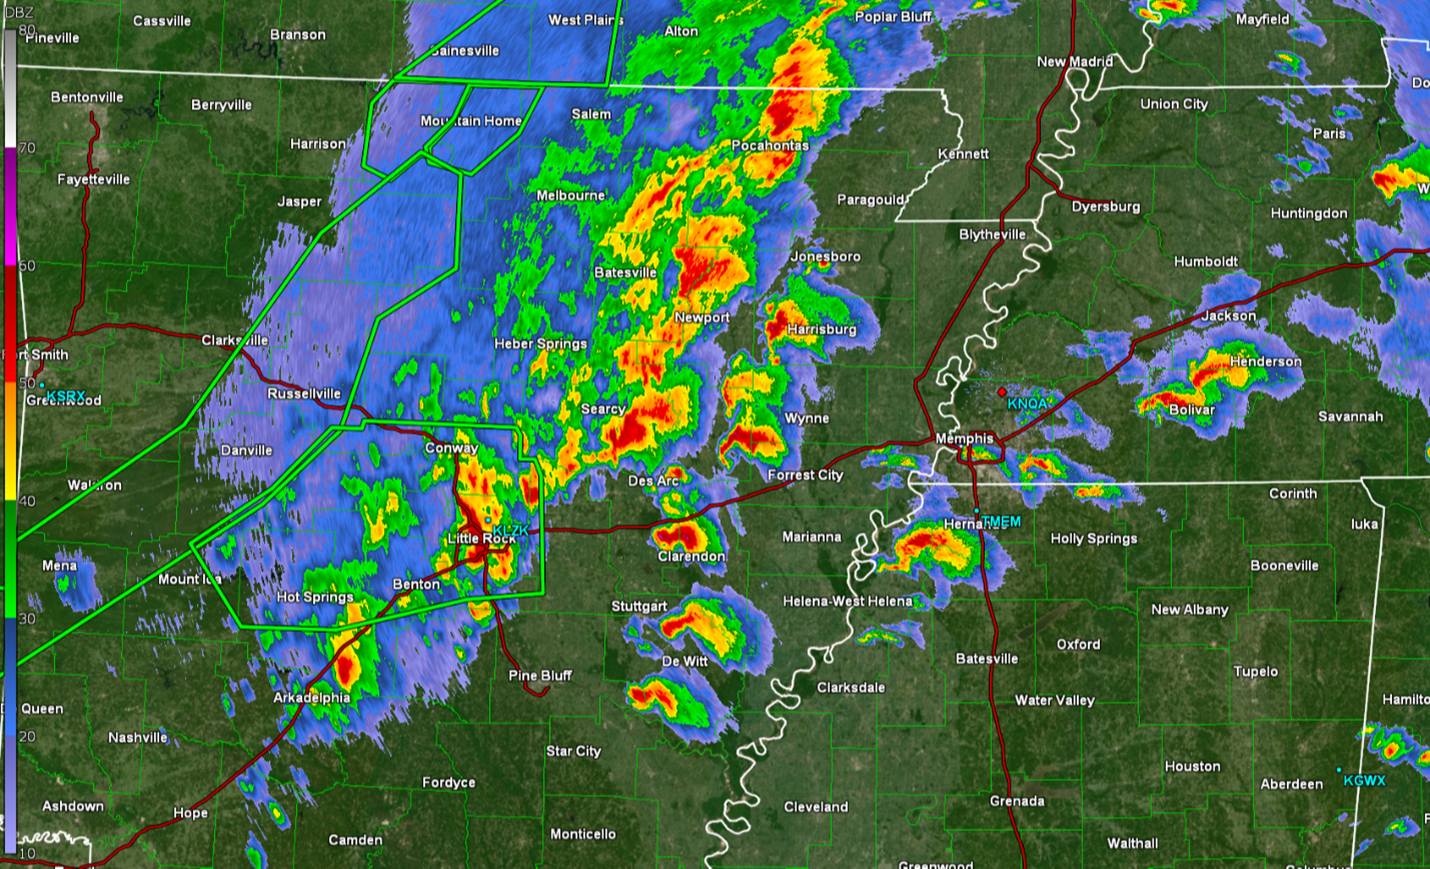
On April 2, 2025, a massive outbreak of tornadoes ravaged the middle Mississippi and Ohio Valley regions, impacting at least eight states from Arkansas to Ohio. Storm chaser Brandon Copic captured live video of a strikingly powerful and visible wedge tornado near Lake City in northeast Arkansas, which many viewers witnessed. Tragically, the tornadoes claimed at least six lives across the affected areas.
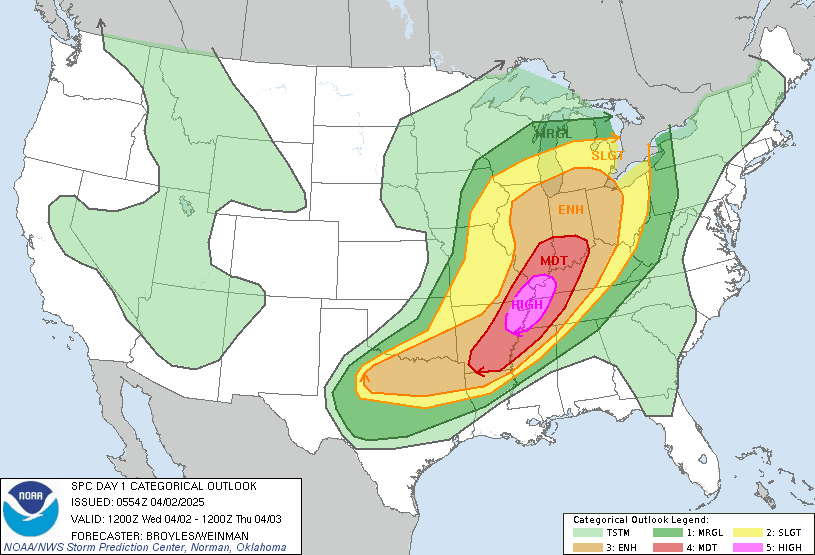
The evening before the tornado outbreak, many storm chasers doubted a significant event would unfold. High-resolution weather models suggested a widespread squall line with embedded supercells would develop, but few expected its intensity. Surprisingly, Chris Broyles, a veteran forecaster at the Storm Prediction Center, escalated the risk level to High.
What was he seeing? What fueled his confidence? Although I haven’t discussed this with Chris yet, subtle clues hinted at a major event. Let’s explore why this outbreak became so explosive.
The Setup
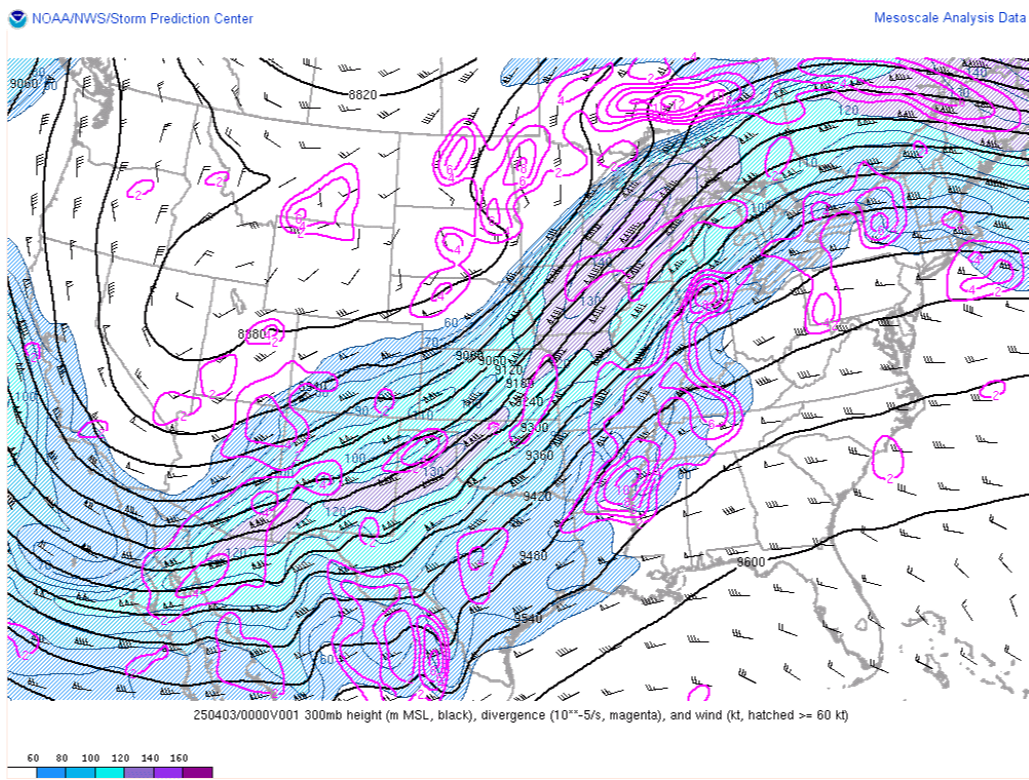
The weather forecast for April 2, 2025, revealed a potent atmospheric pattern across the central United States. At the 300 mb level, a powerful jet streak with winds of 135 to 145 knots swept into the Great Lakes, positioning the southern risk area within its right entrance region. This placement signaled strong upper-level divergence and rising air motion over the Middle Mississippi Valley. This feature was critical, as it delivered significant lift across much of the risk area, a factor highlighted by the divergence lines (shown in pink below).
Simultaneously, abundant high-quality moisture saturated the lower atmosphere, with mean mixing ratios exceeding 15 g/kg near the surface. A dryline stretched from northern Texas to southern Wisconsin, accompanied by a surface low in western Wisconsin and dewpoints topping 65°F across the risk area. Surprisingly, it wasn’t the dryline but a distinct confluence boundary that served as the main driver of surface convergence. (For clarity, confluence refers to a wind pattern where air flows inward toward an axis aligned with the general direction of movement.) This boundary spanned from southern Arkansas through southeast Missouri to western Indiana.
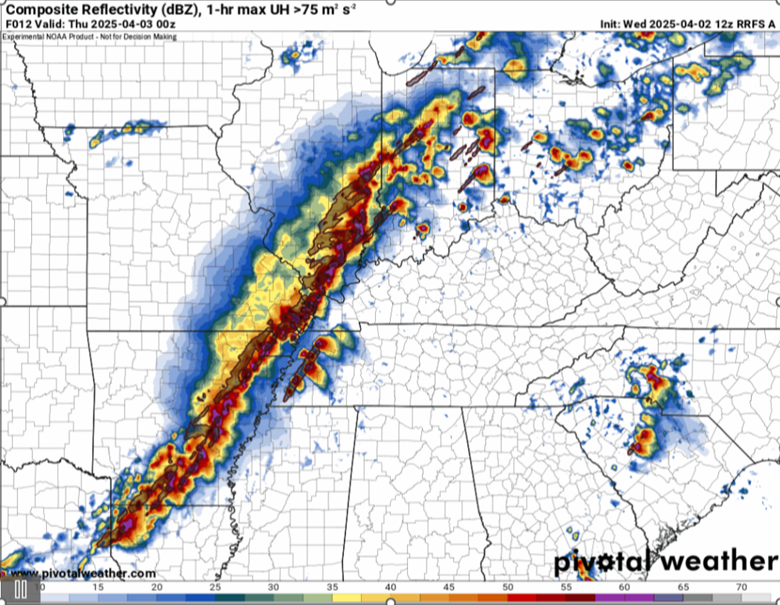
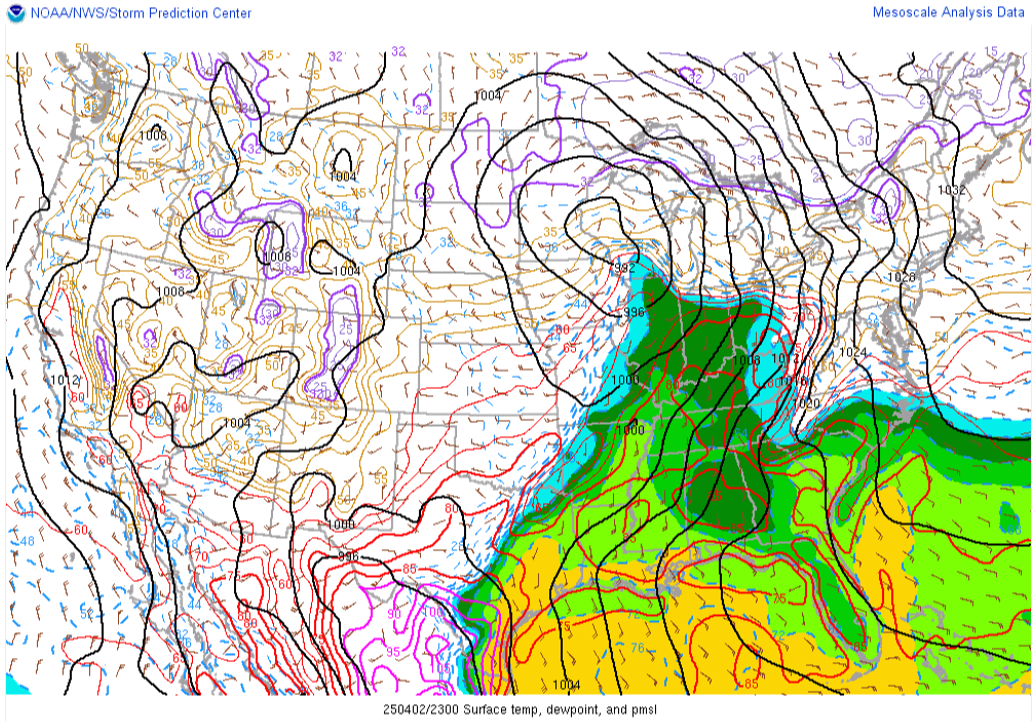 With the 0-6 km shear vector aligned from southwest to northeast, along with surface convergence along the confluence axis, conditions were ripe for squall line development. As such, most high-resolution models predicted a widespread quasi-linear convective system would take shape across much of the risk area—which is what occurred. The surprise, however, came when multiple powerful supercells formed ahead of the line.
 Why It Happened
How did numerous supercells form ahead of the squall line? A key factor was the near absence of a capping inversion. Convective Inhibition (CIN) remained at 0 J/kg, even in the morning, allowing storms to develop freely without suppression.
At the same time, the atmosphere was highly conducive to intense supercell growth due to significant instability across the region. Mixed Layer Convective Available Potential Energy (MLCAPE) values exceeded 1000 J/kg from northeast Texas to eastern Illinois, reaching as high as 3000 J/kg in eastern Arkansas. . These conditions were enhanced by strong shear parameters: 0-6 km shear surpassed 50 knots, and 0-1 km storm-relative helicity ranged from 200 to 400 m²/s², creating an environment highly favorable for tornadoes.
This setup likely aligned with what forecaster Chris Broyles anticipated. While a squall line was expected to form, the weak cap ahead of the dryline allowed storms to tap into the ideal conditions for supercell development.
To predict this, Broyles relied on his expertise rather than high-resolution models, most of which failed to capture the development of these “open warm sector” storms. Only one model, the RRFS, suggested that such supercells might form, but arguably, it didn’t provide enough certainty to justify upgrading to a High Risk. This highlights the remarkable skill of SPC forecasters like Broyles and underscores why their forecasting abilities deserve respect.
What We Can Learn
This event underscores the danger of relying solely on high-resolution model outputs. While these models provide valuable guidance, they aren’t infallible. A thorough meteorological analysis is essential to uncover subtle atmospheric dynamics, such as the role of the weak capping inversion on April 2nd. To perform this kind of analysis, a foundational understanding of reading and interpreting meteorological charts is crucial.
To help you build that skill, I’ve developed a free course designed to equip you with the basics. You can access it here.
For those eager to dive deeper, I’ve also created an 8-hour, self-paced online course called The Tornado Chaser Transformation. Drawing from my 25+ years of storm-chasing experience, it covers everything you need to know to chase storms effectively. Learn more here.
